While it is much easier and more efficient to use a debugger such as x-debug to debug your PHP web application, there may be some difficulties on the server stopping one from implementing x-debug. In this case, we are forced to use the classic debug methods instead. This article will elaborate on the implementing classic methods in web programming.
Displaying Debug Messages
The simplest way to debug is to display debug messages. The standard PHP function to do this is “var_dump()“. var_dump() can be used to display data, including arrays and objects. With large objects or arrays, the data may be truncated, so you may need to specify the element in the array or object or specifically cast it to a string if it is a virtual string. You can also use var_dump() or echo to confirm that a certain line was indeed executed.
One disadvantage is that having these extra displays, if left in the production code, there could be unprofessional looking displays on the website. To avoid this, one should always check the diff before checking in the code. But then again, if the problem occurs on production, you will never be able to use this method to debug, as it will disrupt the website. To avoid this potential pitfall, there are alternatives.
One alternative debugging method is writing it to a log. This will enable to website to display correctly, while the error may be checked only by those with access to the log. In addition, one can set up their system to write to the log in different events in order to diagnose potential issues and monitor system behavior. Another possibility is to use a tool such as firePHP (a Firefox plugin), in order to have messages only displayed in the firePHP. This may allows the developer to check without having to access a log. Still, since anyone can install firePHP and view your confidential debugging messages, it is best to have it turned off in production.
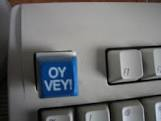
“Oy Vey” Debugging – Forcing a Crash
One problem with the previous approach is that the method is prone to failure. The log could fail to be written for a number of reasons.
var_dump() and echo could be disabled if the system buffers and flushes the output. Using third-party plugins is also not 100% reliable. Browsers and plugins are always being updated, and new versions can have compatibility issues.
Another issue is that, while displaying or logging a message will indicate that a line of code was executed, it will might not tell you how you got there. You can still use debug_backtrace(), but there is another way.
trigger_error('oy vey');
throw new Exception('oy vey');
The error screen now displays all the info you need.
Still, some systems will trap your errors, so in order to force a fatal error by calling a non-existent function.
oyvey();
Or you can also try
die('oy vey');
Just make sure to remove all the debugging stuff before checking in your changes. The grand World Wide Web audience wants to see a working website and not “oy vey”.
The Blank Screen
Sometimes, none of this helps. Something is causing the program to crash, and your page turns up blank. How do you find the guilty line of code? Sometimes, with thorough knowledge of you project, you can guess what the problem is. But what when you have no idea why your page is blank? One possibility is to go to the top starting code in your system is see what executes. From there, you can work your way top-down into sub-functions. Another classic debugging method is to comment out everything and uncomment until you find the guilty line.
Using these different methods, you can generally solve your website’s issues without a debugger.
